


Data is information we can collect. We can represent data in pictographs and bar graphs.
To better understand data: pictographs & bar graphs…
LET’S BREAK IT DOWN!
Count balloons using tally marks.
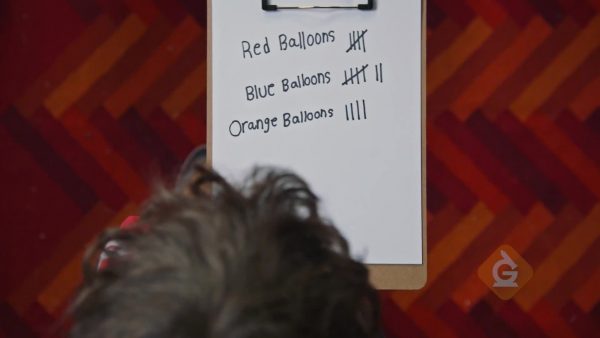
You have some balloons. You can use tally marks to show how many you have of each color. There are 5 red balloons: ||||. There are 7 blue balloons: |||| ||. There are 4 orange balloons: ||||
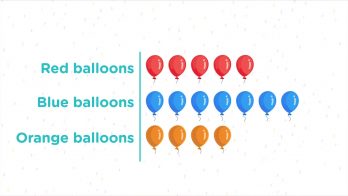
Draw a pictograph to show balloons.
A pictograph uses pictures to show data. You can make a pictograph to show the colors of your balloons. Draw a line. On one side of the line, write "Red." On the other side, draw 5 red balloons in a row. You can do the same each color. Every graph needs a title: "Number of Balloons I have." A key shows that 1 balloon picture represents 1 balloon.
Read a pictograph about cupcakes.

You have a pictograph with the title "Bake Sale Items Sold." This pictograph tells how many of each bake sale item was sold. The key shows that one dot = 1 item. Cupcakes have 7 dots. That means 7 cupcakes were sold.
Make a bar graph to represent BBQ foods.
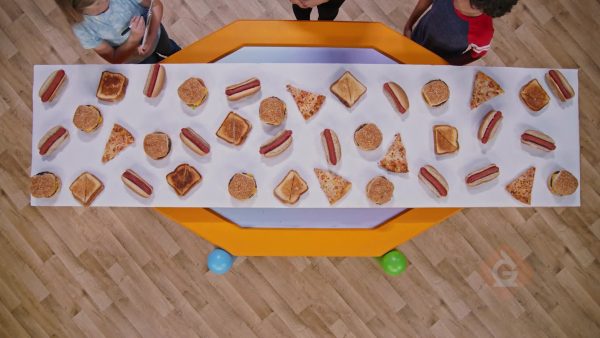
You need 10 hamburgers, 6 slices of pizza, 14 hotdogs, and 8 grilled cheese sandwiches for your BBQ party. You can use a bar graph to show your data. The height of a bar shows how many you have in a category. The bar for hamburgers is 10 units high. The bar for pizza is 6 units high. Title the graph "Types of Food We Have.”
Read a bar graph about pets.

A bar graph has a title "Types of Pets People Have." That tells you that the graph represents the number of different types of pets different people have. The bar for 'no pets' is 5 units high, so 5 people have no pets. The bar for 'dogs' is 9 units high, so 9 people have dogs.


 Select a Google Form


 GENERATION GENIUS