Reading Material
1%
It was processed successfully!
WHAT IS DATA?
Data is information we can collect. We can represent data in pictographs and bar graphs.
To better understand data: pictographs & bar graphs…
WHAT IS DATA?.
Data is information we can collect. We can represent data in pictographs and bar graphs.
To better understand data: pictographs & bar graphs…
LET’S BREAK IT DOWN!
Count balloons using tally marks.

You have some balloons. You can use tally marks to show how many you have of each color. There are 5 red balloons: ||||. There are 7 blue balloons: |||| ||. There are 4 orange balloons: ||||
Count balloons using tally marks. You have some balloons. You can use tally marks to show how many you have of each color. There are 5 red balloons: ||||. There are 7 blue balloons: |||| ||. There are 4 orange balloons: ||||
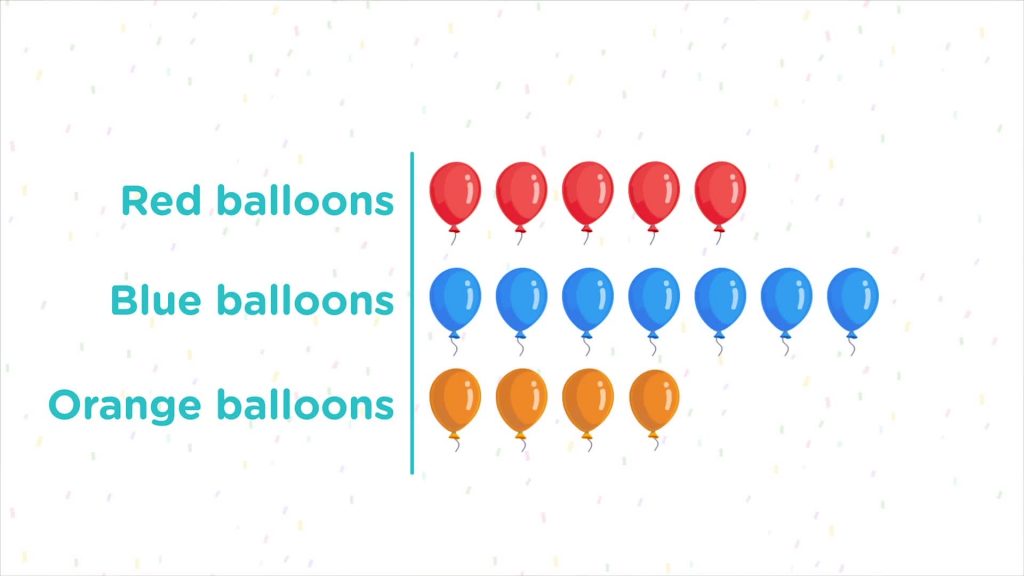
Draw a pictograph to show balloons.
A pictograph uses pictures to show data. You can make a pictograph to show the colors of your balloons. Draw a line. On one side of the line, write "Red." On the other side, draw 5 red balloons in a row. You can do the same each color. Every graph needs a title: "Number of Balloons I have." A key shows that 1 balloon picture represents 1 balloon.
Draw a pictograph to show balloons. A pictograph uses pictures to show data. You can make a pictograph to show the colors of your balloons. Draw a line. On one side of the line, write "Red." On the other side, draw 5 red balloons in a row. You can do the same each color. Every graph needs a title: "Number of Balloons I have." A key shows that 1 balloon picture represents 1 balloon.
Read a pictograph about cupcakes.

You have a pictograph with the title "Bake Sale Items Sold." This pictograph tells how many of each bake sale item was sold. The key shows that one dot = 1 item. Cupcakes have 7 dots. That means 7 cupcakes were sold.
Read a pictograph about cupcakes. You have a pictograph with the title "Bake Sale Items Sold." This pictograph tells how many of each bake sale item was sold. The key shows that one dot = 1 item. Cupcakes have 7 dots. That means 7 cupcakes were sold.
Make a bar graph to represent BBQ foods.
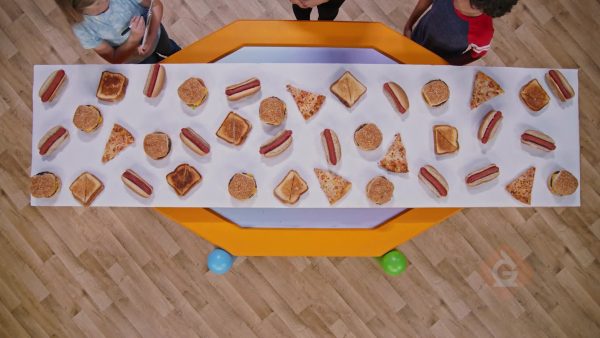
You need 10 hamburgers, 6 slices of pizza, 14 hotdogs, and 8 grilled cheese sandwiches for your BBQ party. You can use a bar graph to show your data. The height of a bar shows how many you have in a category. The bar for hamburgers is 10 units high. The bar for pizza is 6 units high. Title the graph "Types of Food We Have.”
Make a bar graph to represent BBQ foods. You need 10 hamburgers, 6 slices of pizza, 14 hotdogs, and 8 grilled cheese sandwiches for your BBQ party. You can use a bar graph to show your data. The height of a bar shows how many you have in a category. The bar for hamburgers is 10 units high. The bar for pizza is 6 units high. Title the graph "Types of Food We Have.”
Read a bar graph about pets.

A bar graph has a title "Types of Pets People Have." That tells you that the graph represents the number of different types of pets different people have. The bar for 'no pets' is 5 units high, so 5 people have no pets. The bar for 'dogs' is 9 units high, so 9 people have dogs.
Read a bar graph about pets. A bar graph has a title "Types of Pets People Have." That tells you that the graph represents the number of different types of pets different people have. The bar for 'no pets' is 5 units high, so 5 people have no pets. The bar for 'dogs' is 9 units high, so 9 people have dogs.
INTRO TO DATA: PICTOGRAPHS & BAR GRAPHS VOCABULARY
Graph
A drawing that displays information.
Data
Information we collect, like the colors or lengths of a group of objects.
Tally Marks
Lines we draw when counting. There are four vertical tallies with the fifth on a diagonal through the four vertical lines. Tally marks make groups of five.
Pictograph
A graph that represents the count of objects in each category using a number of pictures.
Key
A key on a pictograph shows how many each picture in the graph represents.
Bar Graph
A graph that represents the count of objects in each category using the height of a bar.
INTRO TO DATA: PICTOGRAPHS & BAR GRAPHS DISCUSSION QUESTIONS
What is a pictograph?
A pictograph is a drawing or type of graph where the number of pictures in each row represents the count of items in a category.
What is a bar graph?
A bar graph is a drawing or type of graph where the height of each bar represents the count of items in a category.
What kinds of attributes can you represent with a pictograph or bar graph?
I can represent categorical attributes like color, or belonging to a particular group, using a pictograph or bar graph.
Why do we use graphs?
Graphs are helpful because they allow us to visualize data in a more concrete way. They also allow us to compare groups more easily, and more concretely, than if we just had numbers.
Why are titles important for graphs?
Titles are important because they let the person reading the graph know what it represents. If a graph is not labeled and does not have a title, it is a drawing without any context and so gives us no useful information.


 GENERATION GENIUS


x
Choose Your Free Trial Period
Get 14 Days Free
By inviting 4 other teachers to try it too.
Skip, I will use a 3 day free trial
Thank You!
Enjoy your free 14 days trial