
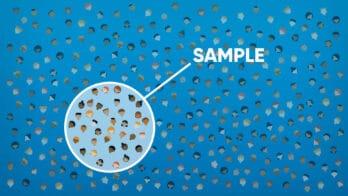


A population is a group that you are interested in knowing something about. A sample of a population is a selection of some members of that population. Random samples are samples made by randomly selecting members of a population.
To better understand Statistics: Random samples & comparing data sets…
LET’S BREAK IT DOWN!
Statistical questions yield various answers.
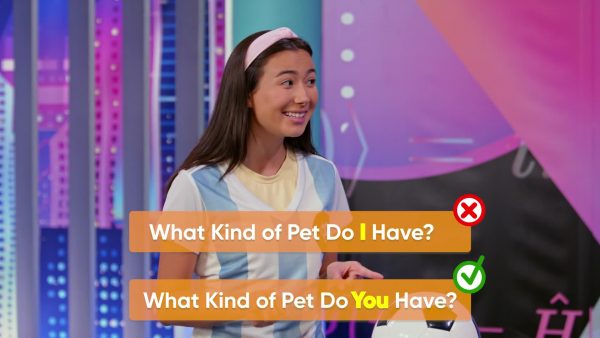
Statistical questions are questions where the answers vary. For example, if I ask, “How much does this dog weigh?” that is not a statistical question. There is only one possible answer: the correct weight. But if you ask many people “What kind of pet do you have?” you get a variety of answers. Emily and Amari are planning a field day for their school. They need to choose the sport to play. Her statistical question is “What sport do students want to play?” Try this yourself: Choose a statistical question. Ask some classmates your question.
Samples can be biased.

Emily and Amari need to decide how to get answers to their question. They could ask everyone in the school, but there are over 1,000 students! That would take a long time. They should only ask a sample of the school population. What if they ask everyone on the soccer team? That sample is biased; the soccer players will likely vote for soccer. Instead, Emily and Amari could sample people at lunchtime. Amari samples 10 people, and all of them selected baseball. That doesn’t make sense, because they know there are lots of people at school who like other sports. Their sample size was too small, which can also make it biased. A good sample is random and has a large enough sample size. Try this yourself: A musician wants to know if people like his new song. He asks 5 people at his most recent concert. Is this a good sample?
You can compare datasets using line plots and means.
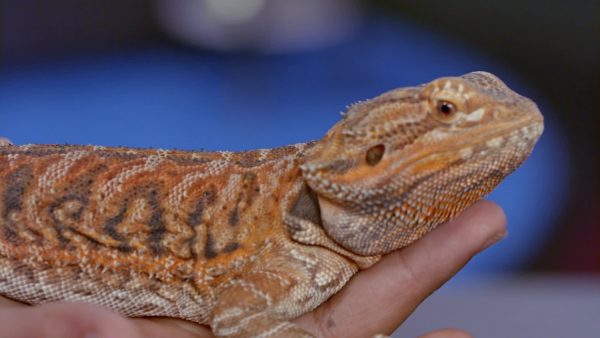
A team of scientists study lizards on a small island and want to know if there is a difference in lengths of male and female lizards. Since there are only about 100 lizards on the island, they sample 20 female and 20 male lizards. The scientists summarize their data in a line plot. You can describe a data set using measures of center, like mean, median, and mode. Amari calculates the mean of the female lizard lengths by adding all the measurements and dividing by the sample size. The mean length for females is 16 cm. The mean length for the male lizards is 20 cm. On the island, the male lizards are about 4 cm longer than the female lizards. You can also compare the data sets based on their range or median. The female lizard lengths are between 6 cm and 21 cm. The male lizard lengths are between 10 cm and 24 cm. What measure you use depends on what question you want to answer. Try this yourself: If another sample from the island has 4 lizards that measure 21 cm, 24 cm, 30 cm, and 10 cm, what is the mean?
A histogram shows the center and spread of data.
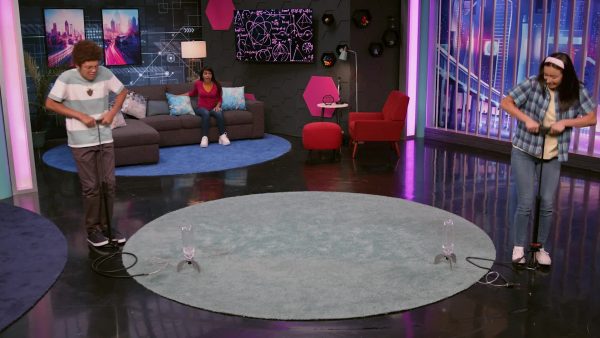
Two 7th grade classes made water rockets and measured how far the rockets went. Adesina uses histograms to compare the distances for each class's water rockets. A histogram is like a bar graph for continuous data. Along the bottom she makes bins for the distances traveled by the rockets, and the side has how many rockets went each distance. A histogram doesn't show the actual measures of center, like mean, median, and mode, but it does provide a useful visual of the data. Since graphs are meant to communicate information, the histogram does this well. Try this one yourself: Choose a statistical question whose answer is a distance or length. Gather data and display it in a histogram.
You can compare datasets using a histogram.
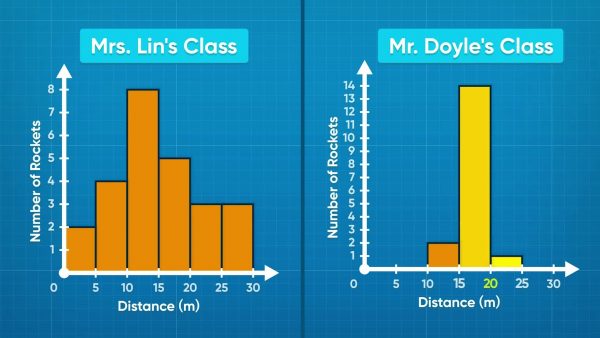
Looking at the rocket histogram for Mrs. Lin's class, Emily notices some small bars at very short and very long distances. The taller bars are near the middle. The short distances mean the rockets didn't fire right. The long distances mean the rocket did very well. The histogram for Mr. Doyle's class looks different. Most of the rockets went 15-20 meters and very few went longer or shorter. This histogram shows that all the rockets worked in Mr. Doyle's class, but none went extremely far. The data are more consistent than in Mrs. Lin's class. Try this yourself: Imagine a scenario where you sample two populations and want to compare them. Sketch two possible histograms that would show that the groups have about the same center, but one is more spread out than the other.
Good data comes from good sampling practices.

The data displayed in a histogram is only valid if it comes from a good sample. Since every water rocket in both classes was measured, the data set is as good as it can be. But if the population is larger, say 20,000 people, measuring everyone is impractical. Then a sample must be taken. Random samples give the best data and need to be large enough to capture the information you need without making the sampling impractical. Try this one yourself: Choose a statistical question. Design a sampling method that would give biased samples.


 Select a Google Form


 GENERATION GENIUS