


You can show data on a line plot that includes fractions. You can count and compare data represented in a line plot to solve problems.
To better understand Line Plots with Fractional Measurements…
LET’S BREAK IT DOWN!
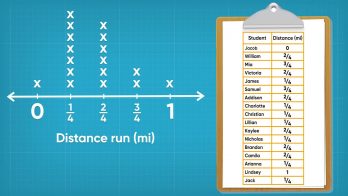
Distance 5th Graders Ran

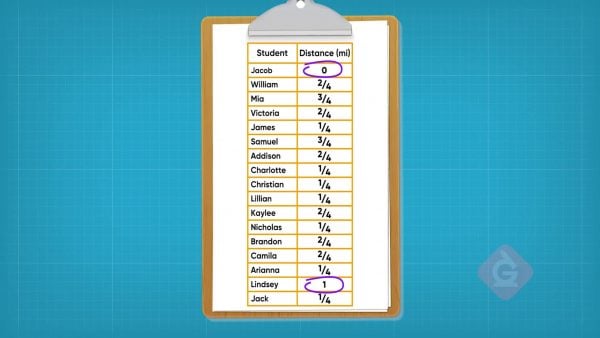
Let's say your coach would like to track how far you and 20 of your classmates can run in six minutes. In particular, she would like to track how far each team member can run rounded to the nearest [ggfrac]1/4[/ggfrac] miles. Your coach recorded the following results: 1 student ran 0 miles, 11 students ran [ggfrac]1/4[/ggfrac] miles, 6 students ran [ggfrac]2/4[/ggfrac]of a mile, 2 students ran [ggfrac]3/4[/ggfrac] of a mile, and 1 student ran 1 mile. Plotting these results on a line graph can help the coach better understand the data and solve problems. The least distance run is 0 miles and the greatest distance run is 1 mile. The first step is to draw a number line from 0 to 1 and divide the line into fourths since the measurements are all in fourths. Halfway between 0 and 1, we place the fraction [ggfrac]1/2[/ggfrac], which is the same as [ggfrac]2/4[/ggfrac]. Halfway between 0 and [ggfrac]2/4[/ggfrac]is [ggfrac]1/4[/ggfrac], and halfway between [ggfrac]2/4[/ggfrac] and 1 is [ggfrac]3/4[/ggfrac], since 1 is the same as [ggfrac]4/4[/ggfrac]. Now that we have a number line with fraction measurements, we can add the 21 data points to the line plot. For each result, we place an X above the measurement. We can see how many students ran 0 miles, [ggfrac]1/4[/ggfrac] of a mile, [ggfrac]1/2[/ggfrac] of a mile, [ggfrac]3/4[/ggfrac] of a mile, and 1 mile. The 6 X's above the [ggfrac]1/2[/ggfrac] measure tells us that 6 students ran [ggfrac]1/2[/ggfrac] of a mile, which is the same as [ggfrac]2/4[/ggfrac] of a mile. Try this one yourself: What does 11 Xs above the [ggfrac]1/4[/ggfrac] mark represent?
More Problem Solving with the Line Plot of 5th Grade Runners' Distances
We can solve problems using the data on the line plot. We can answer "how many more students ran [ggfrac]1/4[/ggfrac]of a mile than ran [ggfrac]3/4[/ggfrac] of a mile?" by finding a difference. 11 students ran [ggfrac]1/4[/ggfrac] mile. 2 students ran [ggfrac]3/4[/ggfrac] of a mile. 11 – 2 = 9. Nine more students ran [ggfrac]1/4[/ggfrac] of a mile than [ggfrac]3/4[/ggfrac] of a mile. Another question that we can answer from the line plot is "how many total miles did the 2 students who ran [ggfrac]3/4[/ggfrac] of a mile run together?" To find the total, we add [ggfrac]3/4[/ggfrac]+[ggfrac]3/4[/ggfrac] = [ggfrac]6/4[/ggfrac]. We can simplify [ggfrac]6/4[/ggfrac] by making it a mixed number. Since [ggfrac]6/4[/ggfrac] is the same as [ggfrac]4/4[/ggfrac]+[ggfrac]2/4[/ggfrac], we write it as the mixed number, 1[ggfrac]1/2[/ggfrac]. Now let's say the coach would like to know how far all of the students who ran [ggfrac]1/4[/ggfrac] mile ran in total. Since 11 students ran [ggfrac]1/4[/ggfrac] of a mile, we can multiply 11×[ggfrac]1/4[/ggfrac] to find the answer. To multiply a whole number by a fraction we keep the denominator the same and multiply the whole number by the numerator of the fraction. The total distance run by all the students who ran [ggfrac]1/4[/ggfrac] of a mile is [ggfrac]11/4[/ggfrac]. We can simplify this by making it a mixed number. The fraction [ggfrac]11/4[/ggfrac] is the same as [ggfrac]8/4[/ggfrac]+[ggfrac]3/4[/ggfrac]which is the same as [ggfrac]4/4[/ggfrac]+[ggfrac]4/4[/ggfrac]+[ggfrac]3/4[/ggfrac]. So [ggfrac]11/4[/ggfrac] is equal to 2[ggfrac]3/4[/ggfrac]. The 11 students who each ran [ggfrac]1/4[/ggfrac] miles ran a total of 2[ggfrac]3/4[/ggfrac] miles together. Try this one yourself: Write a numerical expression to help answer the question "how many miles did the 2 runners who ran [ggfrac]3/4[/ggfrac] miles run in total?"
Sharks

Let's say that you would like to help out the local aquarium by measuring their 30 baby leopard sharks and displaying these measurements on a line plot for visitors to see. The shortest shark is 19[ggfrac]1/8[/ggfrac] inches long. The longest shark is 20[ggfrac]7/8[/ggfrac] inches long. To represent this range of data on a line plot, we draw the plot from 19 inches to 21 inches. We use a scale between whole numbers of [ggfrac]1/8[/ggfrac] inch. The numbers on the line plot are: 19, 19[ggfrac]1/8[/ggfrac], 19[ggfrac]2/8[/ggfrac], 19[ggfrac]3/8[/ggfrac], 19[ggfrac]4/8[/ggfrac], 19[ggfrac]5/8[/ggfrac], 19[ggfrac]6/8[/ggfrac], 19[ggfrac]7/8[/ggfrac], and 19[ggfrac]8/8[/ggfrac] which is 20! We can mark off [ggfrac]1/8[/ggfrac] from 20 to 21 the same way. Then we take the 30 measurements from our data table and mark an X above the measurement on our line plot. When all of the data values are marked we can learn a lot about our data. For instance, since there are 7 Xs above 19[ggfrac]7/8[/ggfrac] on our line plot, we know that there are 7 sharks that are 19[ggfrac]7/8[/ggfrac] inches long. Since 20[ggfrac]4/8[/ggfrac] has 4 Xs above it and 19[ggfrac]3/8[/ggfrac] has 1 X above it, we can figure out how many more sharks measure 20[ggfrac]4/8[/ggfrac] inches than 19[ggfrac]3/8[/ggfrac]inches by subtracting: 4-3=1. Try this one yourself: What is the difference between the longest baby shark and the shortest baby shark?
Shark Problem Solving

We can solve more problems about the sharks using our line plot. For example, we can see that 14 sharks are smaller than 20 inches long. Let's say we want to know the combined length of the two largest sharks. Add together the two longest measurements: 20[ggfrac]6/8[/ggfrac] and 20[ggfrac]7/8[/ggfrac]. Starting with the fractions, we add [ggfrac]6/8[/ggfrac]+[ggfrac]7/8[/ggfrac]=[ggfrac]13/8[/ggfrac]. We can break [ggfrac]13/8[/ggfrac]down into [ggfrac]8/8[/ggfrac] and [ggfrac]5/8[/ggfrac], which is 1[ggfrac]5/8[/ggfrac]. Next, we add 20+20=40. We combine our two sums 40+1[ggfrac]5/8[/ggfrac]=41[ggfrac]5/8[/ggfrac]. The two longest sharks combined measure 41[ggfrac]145/8[/ggfrac] inches long. Try this one yourself: What is the combined length of the three smallest baby sharks?


 Select a Google Form


 GENERATION GENIUS