A relation shows a relationship between two quantities. A function is a special type of relation that, for each input, gives exactly one output.c definition here
To better understand functions…
LET’S BREAK IT DOWN!
Use an equation to represent a function for carnival tokens.
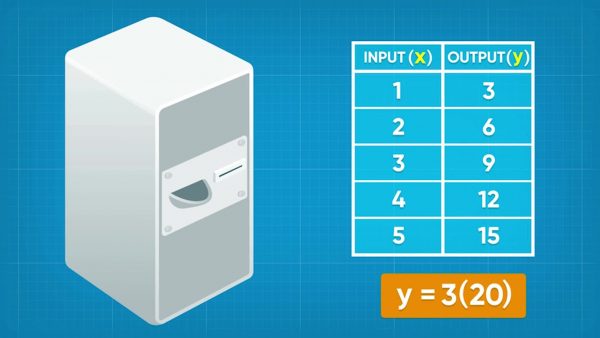
Emily wants to buy tokens for the carnival. The token machine says one dollar buys three tokens. A function is a special type of relation where one input gives one output. The machine works like a function, with an input of dollars and an output of tokens. You can represent the function mathematically using the equation y=3x, where x represents the number of dollars and y represents the number of tokens. If you want to know how many tokens she gets for $20, substitute 20 into the function for x and calculate the output number of tokens, y. For y=3x, y=320=60. So Emily gets 60 tokens if she puts $20 into the machine. Try this yourself: How many tokens does Emily get for $30?
Identify functions in lists and graphs.
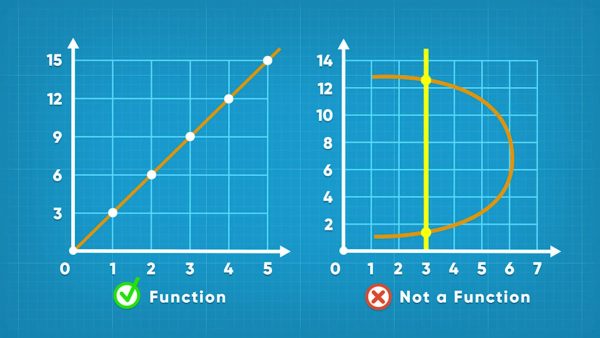
You can use an equation to generate a set of ordered pairs for a function. For example, the equation y=3x generates the ordered pairs {(1, 3), (2, 6), (3, 9), (4, 12), (5, 15)...}. Notice that in the set of ordered pairs, no x-values are repeated within the set, which tells us that it is a function. You can graph those points and connect them to show the graph of the function. In a function, each input (x-value) can only produce one output (y-value). If you draw a vertical line on the graph, then this vertical line only crosses the function once at any given x-value. The Vertical Line Test is a method to determine if a graphed relation is also a function. To conduct the test, imagine scanning a vertical line from left to right on the graph of a relation. If at any point the vertical line crosses the function twice, the relation fails the test, and it is not a function. Try this yourself: Use a graphing calculator to graph a relation. Use the vertical line test to see if the relation is a function.
Linear functions are relations with a rate and a constant.
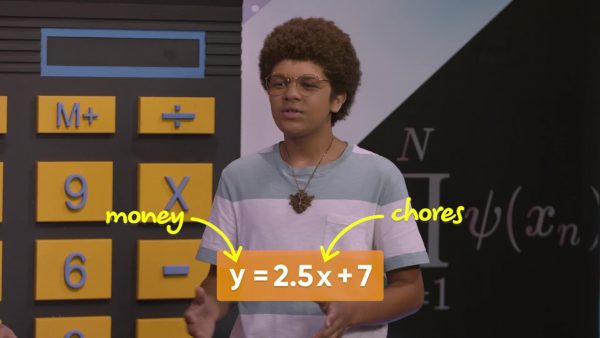
Kenzie make $7 a week in allowance plus $2.50 per chore. You can represent the relation between the number of chores Kenzie does (x) and the number of dollars he earns in a week (y) with the equation y=2.5x+7. Each number of chores Kenzie does produces a different amount of allowance. So, this relation is also a function. This function has a rate ($2.50/chore) and a constant ($7). This function is a linear function. Try this yourself: Determine the amount of allowance Kenzie makes if he does 1 to 10 chores in a week, and then represent this function in a table of values, a set of ordered pairs, and a graph.
Use function notation to represent the relation between Fahrenheit and Celsius.

You want to make tanghulu, a treat made of fruit in a candy coating. To make the candy, you need to heat the sugar to 149°C, but your thermometer is only marked in Fahrenheit. Fortunately, the function f(x)=1.8x+32 converts temperature in Celsius to temperature in Fahrenheit. The function is written in function notation, and f(x) is read as “f of x”, meaning a function of x. Function notation is helpful because it allows you to see the ordered pair directly from the function notation. For example, to calculate the temperature you need, you first substitute 149°C everywhere there is an “x”, giving f(149)=1.8(149)+32. Then evaluate: f(149)=300.2. In the function notation you can directly see the x-value that produces each output or y-value: f(x)=y. You can easily write the ordered pair (149, 300.2). Now you know that you need to heat the sugar to 300.2°F when your make your tanghulu. Try this yourself: A fudge recipe requires you to cook the sugar to the soft ball stage of 113°C, what is this temperature in degrees Fahrenheit?












 Select a Google Form


