


A line plot is a type of graph that shows information on a number line. You can use a line plot to display data. Line plots can help you solve problems with your data.
To better understand line plots…
LET’S BREAK IT DOWN!
Start building a line plot.
Information that we collect is called data. A line plot is a number line. The start number is the least number in your data. The end number is the greatest number in your data. Label all of the whole numbers in between. Now you are ready to add your data.
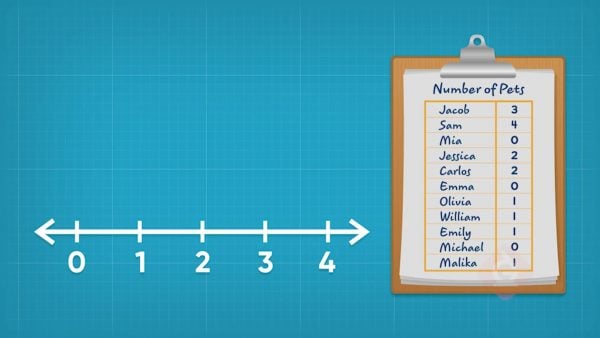
Plot the number of pets on a line plot.
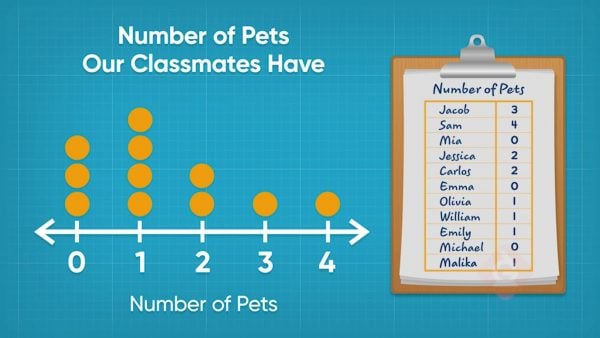
You asked your classmates how many pets they have. You make a line plot to show your data. The plot has a title: "Number of Pets." All of your classmates have between 0 and 4 pets. The number line should show the numbers 0, 1, 2, 3, and 4. Put an X over a number for each classmate who has that many pets. If Sam has 4 pets, put an X over the 4 for Sam.
Plot the number of soccer goals on a line plot.
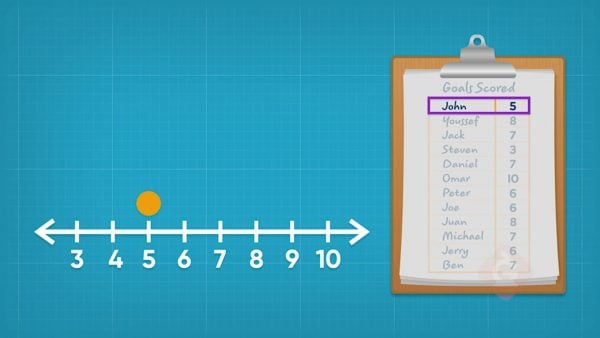
You recorded the number of goals each teammate scored in soccer this year. You want to make a line plot to show your data. The plot has the title “Number of Goals Scored.” The least number of goals scored was 3. The greatest was 10. So, your line plot shows the numbers 3 to 10. Plot a point for each teammates' goals. You scored 5 goals, so put an X over the 5 for you!
Interpret your soccer goal line plot.
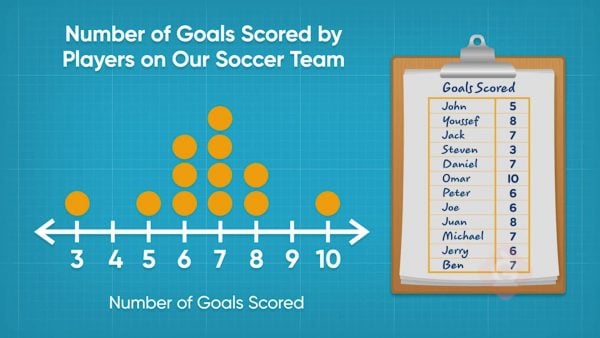
A line plot tells us lots of different information. The soccer goals line plot tells you that every player scored 3 or more goals. One player scored 10 goals. The most common number of goals was 7 since it has the most Xs above it.
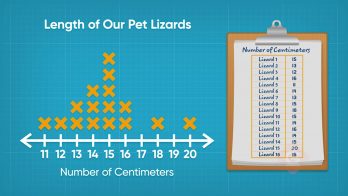
Plot the length of geckos on a line plot.

You measured the length of each gecko in a tank. You make a line plot of all of your data. After you make your line plot, you notice that there are no points over 15. This means that no gecko in the tank is 15 cm long. There are 2 points above 21. So 2 geckos in the tank are 21 cm long.


 Select a Google Form


 GENERATION GENIUS