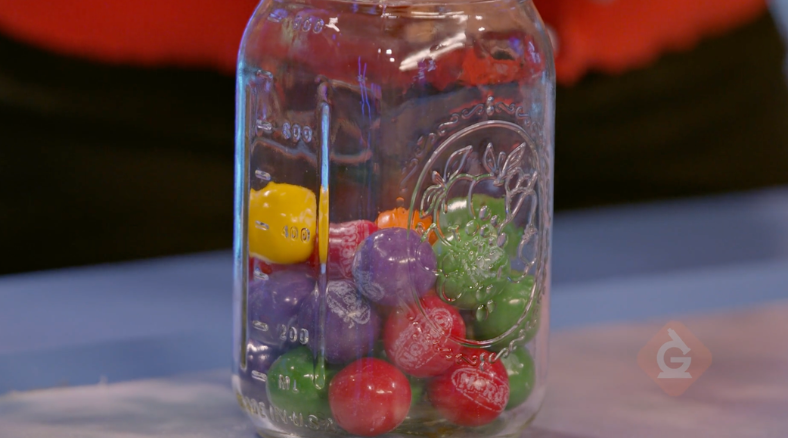
Use the classroom candy obsession to help boost curiosity around math this holiday season. Before the sugar crash, here’s how to turn that chaos into actual data analysis.
Start Here: A Bag of Candy
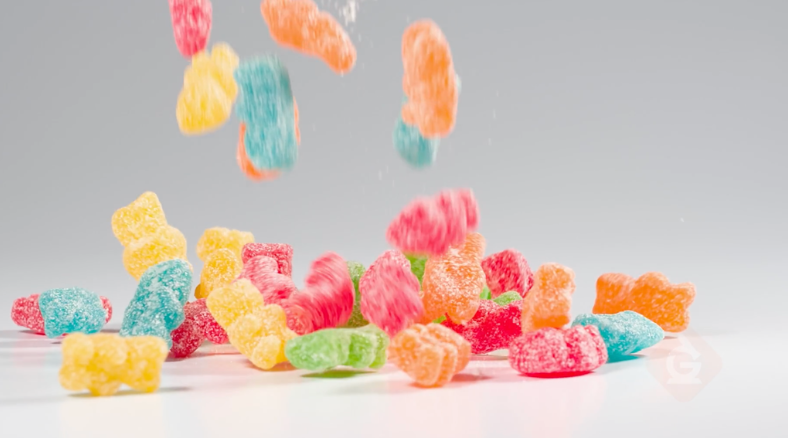
Ask your students if every fun-size bag of Skittles has the exact same number of red candies. Write down what they say.
Most will tell you yes, or assume the candy factory counts them out perfectly.
Here’s the fact that makes them pay attention: Candy color distribution is completely random.
Try telling a third grader that their pile of M&Ms has zero blue ones by pure statistical chance, not because someone stole them.
Halloween Math Resources by Grade
| Resource | Best For | Prep Level |
| Classify Objects by Attribute (Color, Size, and Shape) | K-2 | Zero prep |
| Intro to Counting in Groups (Arrays) | K-2 | Zero prep |
| Intro to Data: Pictographs & Bar Graphs | K-2 | Zero prep |
| Intro to Data: Line Plots | K-2 | Zero prep |
| Scaled Picture Graphs & Bar Graphs | 3-5 | Zero prep |
| Line Plots with Fractional Measurements | 3-5 | Zero prep |
| Intro to Division | 3-5 | Zero prep |
| Intro to Remainders in a Division Problem | 3-5 | Zero prep |
| Scatter Plots (Displaying Bivariate Data) | 6-8 | Zero prep |
| Statistics: Random Samples & Comparing Data Sets | 6-8 | Zero prep |
| Mean, Median, & Mode | 6-8 | Zero prep |
| Probability: Single Events | 6-8 | Zero prep |
Grades K-2: Candy Sorting & Bar Graphs
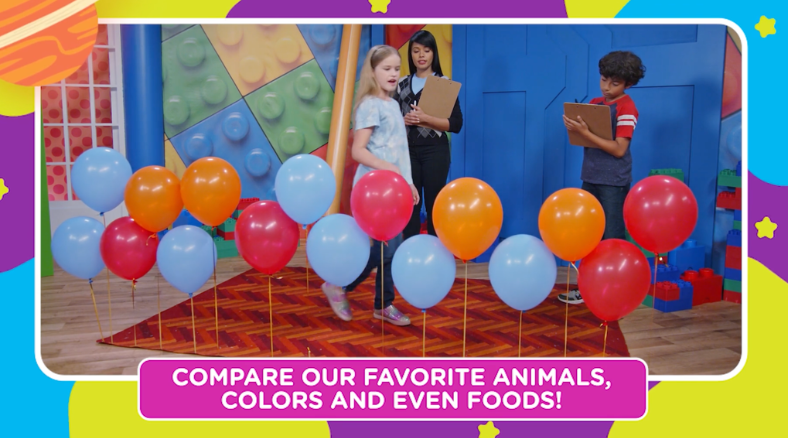
K-2 learners can’t sit still in their costumes. They need tactile tasks. Give them handfuls of candy to sort by color and turn into a bar graph before they try to eat the data.
Intro to Data: Pictographs & Bar Graphs Activities + Video
Grades 3-5: Line Plots & Sugar Data
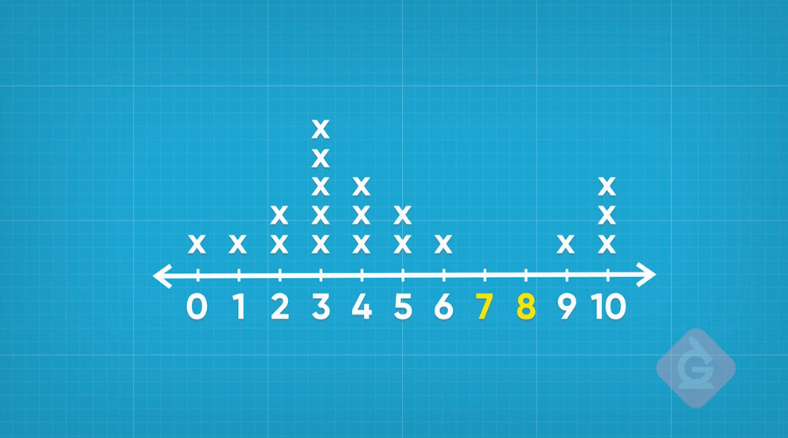
3-5 students think they are too old for the class parade, but they still want the candy. Harness that energy by having them plot the frequency of different candy weights or types across the whole classroom to look for outliers. For more on data, check out scaled picture & bar graphs.
Line Plots with Fractional Measurements Activities + Video
Grades 6-8: Scattered Plots & Candy Piles
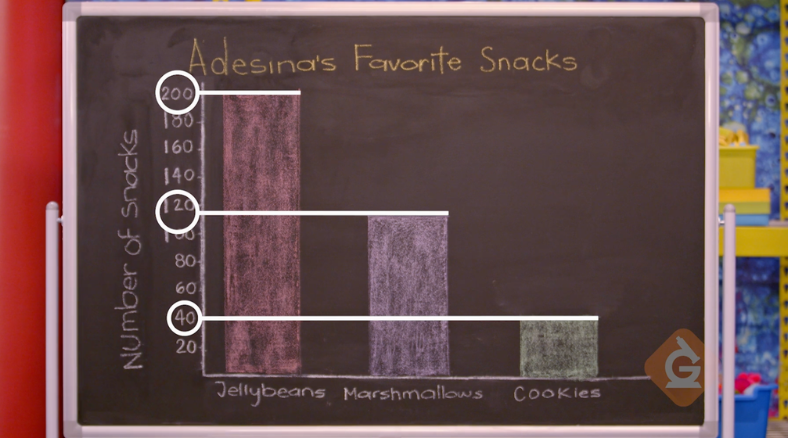
6-8 kids are ready to dive into candy before class starts. Give them motivation to better understand the why behind which candies they pick to eat first. A little digging and students can see which candy ranks highest in the class.
Scatter Plots Activities + Video
The “I Have 20 Minutes Before The Class Party” Version
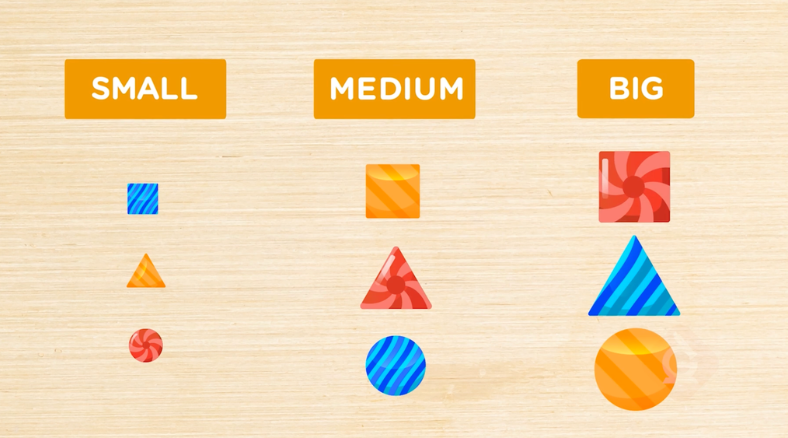
No time to prep? Here’s exactly what to do:
Minutes 1-5: Dump the candy on their desks. Have them sort their pile by color or type and tally the results.
Minutes 6-15: Play the Generation Genius data video (Intro to Counting in Groups K-2, Scaled Picture Graphs & Bar Graphs 3-5, or Scatter Plots 6-8 ) while they construct their graphs from their tallies.
Minutes 16-20: Have them compare their graphs with a neighbor to prove that candy distribution is random.
Halloween is more than just surviving the sugar rush. It’s a built-in data set waiting to be analyzed. Give them the tools to map the data and they’re ready to learn from day one.
For more halloween fun, check out Halloween Science Lessons & DIY Activities (K-8)


 GENERATION GENIUS