 GENERATION GENIUS


Science & Math
$/yr

Coming back from winter break is hard enough without the pressure of “New Year, New You.” Here’s how to turn vague resolutions into actual data analysis while your coffee is still hot. Turn new year goal setting for grades K-8 into the most-talked-about project of the year.

Ask your students how they plan to track their New Year’s resolutions. Write down what they say.
Most will tell you they’ll “just remember” or “try harder.” They’re wrong—and if you don’t surface this belief before teaching, their goals will be dead by February.
Here’s the fact that makes them pay attention: Human memory is objectively terrible at tracking progress. Try telling a kid that if a scientist just “remembered” how many times a chemical reacted, nobody would believe the result. Without a graph, a resolution is just a wish that lacks evidence.
That’s the whole thing. Everything else is details.
In fact, a little bit of student collaboration can get the class where they need to be. According to Edutopia, peer-led interviews can provide direction and a clear vision with where your students want to be. Developing SMART goals and aligning them through data can help frame dreams to actionable data-driven results.

| Resource | Best For | Prep Level |
| Introduction to Data | Grades K-2 | Zero prep |
| Collect & Organize Data | Grades 3-5 | Zero prep |
| Probability & Data | Grades 6-8 | Zero prep |
| Represent Data | Grades 6-8 | Zero prep |
At this age, “better” is a feeling. They need to see that data is just a way to turn feelings into facts. We focus on simple tallies and bar graphs because it’s the only way to prove that reading 20 minutes a day actually adds up to something.
Statistics random sample video for kids here
Middle schoolers think resolutions are “cringe” until you bring in the math of probability. They need to understand that their “streak” of homework completion is a data set that predicts future performance.
“The data representation lesson is one of the few DIY activities I can do when my brain is fried after the winter break. It moved them from ‘I’ll try’ to ‘Here is my trend line.’ They didn’t even realize they were doing statistics.”
— Marcus, 7th Grade Teacher, Texas
Probability and Data Video for Kids video here
No time to prep? Here’s exactly what to do:
Minutes 1-5: Ask: “What is the difference between a wish and a goal?” (Answer: A piece of paper and a pencil).
Minutes 6-15: Watch the Introduction to Data or Represent Data video.
Minutes 16-20: Have them draw a blank Y-axis for the next seven days.
That’s it. You taught a core standard while the rest of the hallway is probably playing holiday catch-up.
Data is more than just numbers in a textbook. It’s the only way to actually see if you’re getting where you want to go.
Don’t let the “resolution slump” win. Use the videos and start tracking.
Nonrenewable energy sources, like coal, oil, and natural gas, cannot be easily replenished. A renewable energy source can be more easily replenished. Common examples of renewable ...
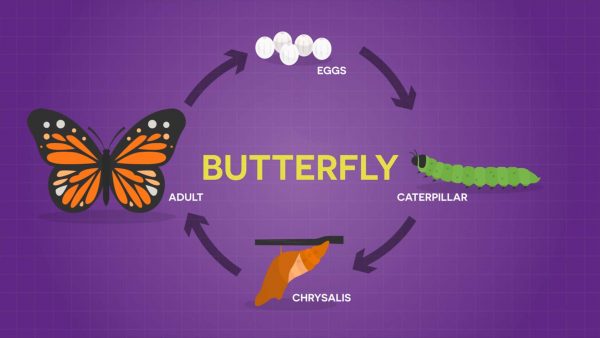
A life cycle is a series of stages a living thing goes through during its life. All plants and animals go through life cycles. It is helpful to use diagrams to show the stages, whi...
It’s January. It’s dark. Half your class is staring out the window wishing they could sleep until March. Use that energy to actually teach hibernation and animal adaptation les...


Skip, I will use a 3 day free trial
Enjoy your free 14 days trial

