
It’s March. Your students are vibrating with bracket energy, and you’re just trying to get through a data unit without someone crying over an upset. Here’s how to use the chaos for actual math.
Start Here: The Misconception That Ruins Everything

Teaching data literacy in elementary school gives students the chance to make the connections between numbers and the real world. According to Edutopia, “Promoting data literacy in the classroom can help students navigate the modern world and promote discorse around data sets.”
Ask your students how they picked their winning team. Write the reasons on the board.
Most will tell you they picked the team with the “coolest mascot” or the one their parents like. They think probability is just “guessing with a sports jersey on.”
Here’s the fact that makes them pay attention: A #16 seed beating a #1 seed was historically considered a “mathematical impossibility” until it actually happened.
Try telling a middle schooler that their “guaranteed” bracket is actually a 1 in 9.2 quintillion long shot. Suddenly, they care about the difference between “likely” and “impossible.”
March Madness Math Resources by Grade

| Resource | Best For | Prep Level |
| Intro to Data & Graphs | Grades K-2 | Zero prep |
| Scaled Picture Graphs & Bar Graphs | Grades 3-5 | Zero prep |
| Statistics | Grades 6-8 | Zero prep |
| Probability | Grades 6-8 | Zero prep |
| Mean, Median, Mode & Range | Grades 6-8 | Zero prep |
Grades K-2: Sorting the Chaos
At this age, “The Big Dance” doesn’t mean much. They don’t need a 64-team breakdown. They just need to understand how to organize what they see. We focus on “Intro to Data & Graphs” to turn the TV highlights into a tally chart. For more holiday fun, check out Valentine’s Day Math Lessons here.
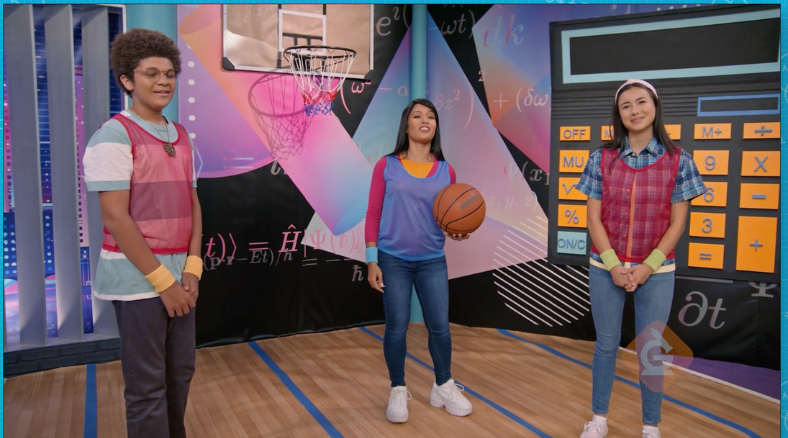
Intro to Data and Graphs video for kids
Grades 3-5: The “Likely” Group
This is where the bracket obsession starts. It’s the perfect time to start to group items together through scaled graphs and pictures. You can use simple materials to predict outcomes.
Scaled picture graphs and bar graphs video for kids
Grades 6-8: Analyzing the Upsets
Middle schoolers love an underdog. Use “Mean, Median, Mode & Range” to analyze team scores. Have them find the “mean” score of a Cinderella team versus a powerhouse. It moves the conversation from “they’re lucky” to “their range is inconsistent.” Analysis wins the classroom.
Mean Median Mode video for kids
The “I Have 20 Minutes Before the Party” Version

Want to get your middle schoolers collaborating? No time to prep? Here’s exactly what to do:
Minutes 1-5: Ask the class: “Is it impossible or just unlikely for a 16-seed to win it all?” Let them discuss for 120 seconds.
Minutes 6-15: Watch the Generation Genius Probability (6-8) or Mean / Median / Mode video.
Minutes 16-20: Do the “Before You Exit” discussion questions on the lesson page.
March Madness is more than just a bracket. It’s a live-action case study in data and probability.
Don’t let the basketball madness win. Use the videos, grab the lesson plans, and turn the noise into numbers.


 GENERATION GENIUS