Reading Material
1%
It was processed successfully!
WHAT IS MEAN, MEDIAN & MODE?
Mean, median, and mode are three different ways to describe the center of a set of data.
To better understand mean, median & mode…
WHAT IS MEAN, MEDIAN & MODE?.
Mean, median, and mode are three different ways to describe the center of a set of data.
To better understand mean, median & mode…
LET’S BREAK IT DOWN!
Find the mean of a set of dog weights.
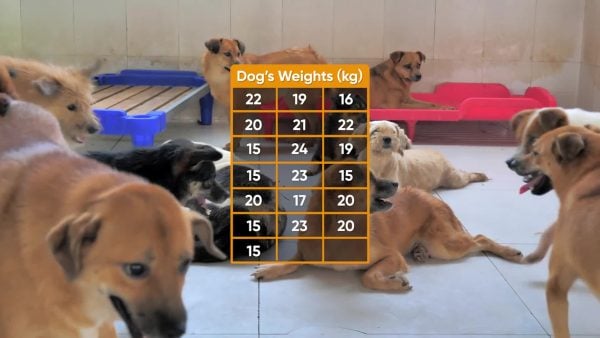
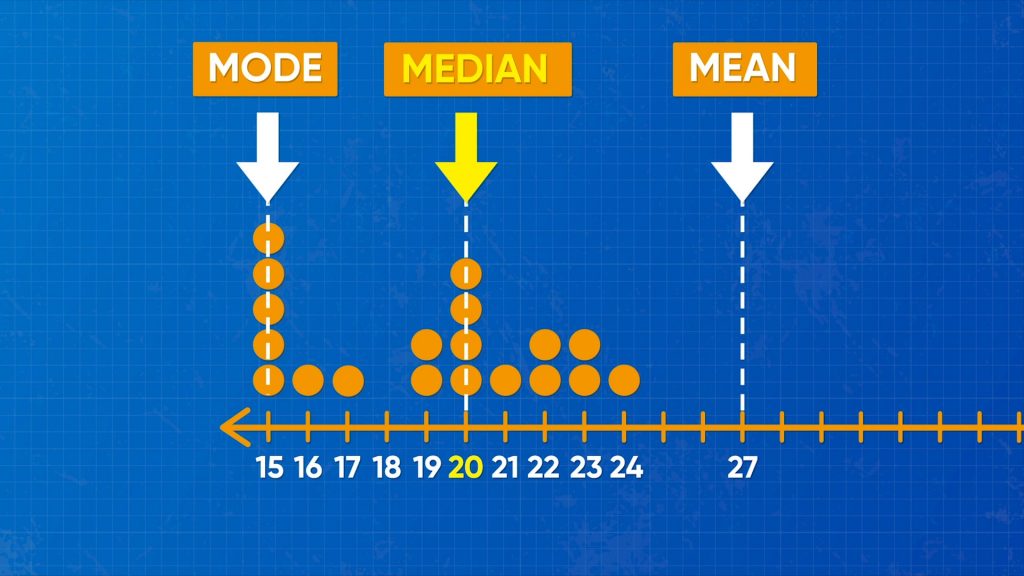
Let’s say you work at a dog shelter, and you need to find out how much food to buy for the dogs. You decide to write the weight of the dogs in order and represent each weight on a line plot. The weights in kilograms in order are: 15, 15, 15, 15, 15, 16, 16, 17, 18, 20, 20, 20, 20, 21, 21, 22, 22, 23, 24, 25. Finding the average (mean) weight of the dogs can help you figure out how much food to buy. The sum of all the weights of the dogs is 380 kg. The number of data points is 20. Divide to find the mean: 380 ÷ 20 = 19. The mean weight of a dog at the shelter is 19 kg. You wonder if two dogs that are a lot heavier (such as 104 kg and 110 kg) joined the other dogs at the shelter, what effect that would have on the mean. Those two weights would be outliers because they are so far away from the other data points. Find the new mean. The total is 594 kg. There are 22 data points now. 594 ÷ 22 = 27. The mean weight is 27 kg. The mean changed a lot with the two heavy dogs added. Outliers can have a huge influence on the mean. When there are outliers, you can use a different measurement called the median. Try this one yourself. You want to find the average weight of the cats at the animal shelter. The cats’ weights in kilograms are: 2, 4, 3, 3, 4, 2, 3. What is the mean weight of the cats? Two more cats come into the shelter. One weighs 7 kg and the other weighs 8 kg. What is the mean weight of the cats at the shelter now?
Find the mean of a set of dog weights. Let’s say you work at a dog shelter, and you need to find out how much food to buy for the dogs. You decide to write the weight of the dogs in order and represent each weight on a line plot. The weights in kilograms in order are: 15, 15, 15, 15, 15, 16, 16, 17, 18, 20, 20, 20, 20, 21, 21, 22, 22, 23, 24, 25. Finding the average (mean) weight of the dogs can help you figure out how much food to buy. The sum of all the weights of the dogs is 380 kg. The number of data points is 20. Divide to find the mean: 380 ÷ 20 = 19. The mean weight of a dog at the shelter is 19 kg. You wonder if two dogs that are a lot heavier (such as 104 kg and 110 kg) joined the other dogs at the shelter, what effect that would have on the mean. Those two weights would be outliers because they are so far away from the other data points. Find the new mean. The total is 594 kg. There are 22 data points now. 594 ÷ 22 = 27. The mean weight is 27 kg. The mean changed a lot with the two heavy dogs added. Outliers can have a huge influence on the mean. When there are outliers, you can use a different measurement called the median. Try this one yourself. You want to find the average weight of the cats at the animal shelter. The cats’ weights in kilograms are: 2, 4, 3, 3, 4, 2, 3. What is the mean weight of the cats? Two more cats come into the shelter. One weighs 7 kg and the other weighs 8 kg. What is the mean weight of the cats at the shelter now?
Find the median and mode of a set of dog weights.
Let’s say you want to find the median weight of the dogs at the shelter. The median is the data point that is right in the middle of the data. To find the median, you start by ordering the data from least to greatest. 15, 15, 15, 15, 15, 16, 16, 17, 18, 20, 20, 20, 20, 21, 21, 22, 22, 23, 24, 25, 104, 110. You cross out the least and greatest values in pairs until you are left with the data point or points in the middle. 15, 15, 15, 15, 15, 16, 16, 17, 18, 20, 20, 20, 20, 21, 21, 22, 22, 23, 24, 25, 104, 110. The middle weight of the dogs is 20 kg. When you find the median, you cross out the numbers at the ends, which eliminates outliers. Now that the data set is sorted, you can also find the most common weight in the data set. This value is called the mode. 15 kg appears 5 times in the data set, which is more than any other value. 15 is the mode. The mean, median, and mode are all called measures of center. Try this one yourself. The cats’ weights in order are now 2, 2, 3, 3, 3, 4, 4, 7, 8. What is the median and what is the mode of the cats’ weights?
Find the median and mode of a set of dog weights. Let’s say you want to find the median weight of the dogs at the shelter. The median is the data point that is right in the middle of the data. To find the median, you start by ordering the data from least to greatest. 15, 15, 15, 15, 15, 16, 16, 17, 18, 20, 20, 20, 20, 21, 21, 22, 22, 23, 24, 25, 104, 110. You cross out the least and greatest values in pairs until you are left with the data point or points in the middle. 15, 15, 15, 15, 15, 16, 16, 17, 18, 20, 20, 20, 20, 21, 21, 22, 22, 23, 24, 25, 104, 110. The middle weight of the dogs is 20 kg. When you find the median, you cross out the numbers at the ends, which eliminates outliers. Now that the data set is sorted, you can also find the most common weight in the data set. This value is called the mode. 15 kg appears 5 times in the data set, which is more than any other value. 15 is the mode. The mean, median, and mode are all called measures of center. Try this one yourself. The cats’ weights in order are now 2, 2, 3, 3, 3, 4, 4, 7, 8. What is the median and what is the mode of the cats’ weights?
Find measures of center of a set of go kart data.

Let’s say you have a set of data that gives the number of laps each of the 20 drivers in a go kart race completed: 5, 8, 3, 4, 4, 5, 6, 7, 8, 6, 6, 8, 6, 4, 5, 3, 4, 5, 8, 5. Find the mean, median, and mode of the data. Find the mean first. 110 ÷ 20 = 5.5. The mean of this data set is 5.5 laps around the track. To find the median, list the data in numerical order from least to greatest: 3, 3, 4, 4, 4, 4, 5, 5, 5, 5, 5, 6, 6, 6, 6, 7, 8, 8, 8, 8. You find that 5 and 5 are both in the middle of the data, so the median is 5. The mean and median are close in this data set because there are no outliers. You see that 5 appears most often, so 5 is also the mode. Try this one yourself. Ten drivers competed in another race. You have the following data on the number of laps each driver completed: 7, 3, 8, 5, 4, 4, 8, 5, 4, 6. Find the mean, median, and mode of the data.
Find measures of center of a set of go kart data. Let’s say you have a set of data that gives the number of laps each of the 20 drivers in a go kart race completed: 5, 8, 3, 4, 4, 5, 6, 7, 8, 6, 6, 8, 6, 4, 5, 3, 4, 5, 8, 5. Find the mean, median, and mode of the data. Find the mean first. 110 ÷ 20 = 5.5. The mean of this data set is 5.5 laps around the track. To find the median, list the data in numerical order from least to greatest: 3, 3, 4, 4, 4, 4, 5, 5, 5, 5, 5, 6, 6, 6, 6, 7, 8, 8, 8, 8. You find that 5 and 5 are both in the middle of the data, so the median is 5. The mean and median are close in this data set because there are no outliers. You see that 5 appears most often, so 5 is also the mode. Try this one yourself. Ten drivers competed in another race. You have the following data on the number of laps each driver completed: 7, 3, 8, 5, 4, 4, 8, 5, 4, 6. Find the mean, median, and mode of the data.
Water bottle rockets (mean, median, and mode).

Let’s say your class of 22 students made water bottle rockets. You record how far the bottles launched and graph the data on a line plot. Here are the distances, in meters: 37, 29, 30, 31, 32, 32, 33, 34, 35, 36, 37, 37, 33, 37, 31, 39, 39, 115, 34, 40, 110, 120. Find the mean, median, and mode of the data. To find the mean, find the sum of the data: 1,001. Then divide: 1,001 ÷ 22 = 45.5 meters. The average distance of the rockets is 45.5 meters. However, it looks like most of the values are between 29 and 40 meters. The mean doesn’t seem to represent the data very well. The outliers 110, 115, and 120 shift the mean. Order the data to find the median: 29, 30, 31, 31, 32, 32, 33, 33, 34, 34, 35, 36, 37, 37, 37, 37, 39, 39, 40, 110, 115, 120. The data values 35 and 36 are in the middle. Find the value that is halfway between the two numbers: 35.5. The median is 35.5 meters. 37 appears most often, so 37 meters is the mode. In this case, the median is a better measure of center than the mean. Try this one yourself. Another class of 20 students made bottle rockets, launched them, and recorded how far each rocket went. Here is their data in meters: 31, 28, 33, 36, 30, 38, 33, 110. Find the mean, median, and mode of their data.
Water bottle rockets (mean, median, and mode). Let’s say your class of 22 students made water bottle rockets. You record how far the bottles launched and graph the data on a line plot. Here are the distances, in meters: 37, 29, 30, 31, 32, 32, 33, 34, 35, 36, 37, 37, 33, 37, 31, 39, 39, 115, 34, 40, 110, 120. Find the mean, median, and mode of the data. To find the mean, find the sum of the data: 1,001. Then divide: 1,001 ÷ 22 = 45.5 meters. The average distance of the rockets is 45.5 meters. However, it looks like most of the values are between 29 and 40 meters. The mean doesn’t seem to represent the data very well. The outliers 110, 115, and 120 shift the mean. Order the data to find the median: 29, 30, 31, 31, 32, 32, 33, 33, 34, 34, 35, 36, 37, 37, 37, 37, 39, 39, 40, 110, 115, 120. The data values 35 and 36 are in the middle. Find the value that is halfway between the two numbers: 35.5. The median is 35.5 meters. 37 appears most often, so 37 meters is the mode. In this case, the median is a better measure of center than the mean. Try this one yourself. Another class of 20 students made bottle rockets, launched them, and recorded how far each rocket went. Here is their data in meters: 31, 28, 33, 36, 30, 38, 33, 110. Find the mean, median, and mode of their data.
MEAN, MEDIAN & MODE VOCABULARY
Mean
The average for a set of data.
Data set
A collection of data.
Median
The middle number in an ordered set of data.
Mode
The value that occurs most often in a set of data.
Line plot
Shows data on a number line.
Data point
A single piece of information.
Data points that are far away from the other data points.
A value that tells us about the center of a data set.
MEAN, MEDIAN & MODE DISCUSSION QUESTIONS
What are the three measures of center? How would you describe each one?
The three measures of center are mean, median, and mode. The mean is the average of a set of data. The median is the middle number in an ordered set of data. The mode is the data value that appears most often.
You have a set of data with a few outliers. Would it be more appropriate to use the mean or the median as a measure of center? Why?
Outliers have a significant effect on the mean, so it would be better to use the median as a measure of center.
You are given this data and asked to find the mean. What are the steps you would use? What is the mean of this set of data? Temperature at Noon Each Day for 10 Days: 74°F, 81°F, 87°F, 83°F, 85°F, 95°F, 83°F, 79°F, 91°F, 72°F
Add the numbers in the data set and divide by the number of data points in the set, in this case 10. The mean is 83°F.
You are given this data and asked to find the median. What are the steps you would use? What is the median for this set of data? Starting at the year 2008, a state-wide census was taken every 2 years until 2020. The census found that the state population, in thousands, was 135.2, 135.3, 136.1, 135.9, 135.8, 136.3, 136.2. What was the median of the population during that time?
List the populations in order from least to greatest. Find the value that is in the middle of the list. That is the median. The median of this data is 135.9 thousand.
You are given this data and asked to find the mode. What are the steps you would use? What is the mode for this set of data?
A group of 5 students decided to see how far they could jump. Here is the data they collected:
Jacy: 2.6 m
James: 2.3 m
Ladawn: 2.7 m
Ping: 2.1 m
Bianca: 2.3 m
I would look for the measurement that appeared most often. 2.3 m appears two times and the other measurements appear one time each. 2.3 m is the mode.


 GENERATION GENIUS


x
Choose Your Free Trial Period
Get 14 Days Free
By inviting 4 other teachers to try it too.
Skip, I will use a 3 day free trial
Thank You!
Enjoy your free 14 days trial