Reading Material
1%
It was processed successfully!

WHAT IS A LINEAR EQUATION?
A linear equation is an equation that makes a straight line when it is graphed. Linear equations can have positive or negative slope and do not have to cross through the origin.
To better understand graphing linear equations and slope…
WHAT IS A LINEAR EQUATION?.
A linear equation is an equation that makes a straight line when it is graphed. Linear equations can have positive or negative slope and do not have to cross through the origin.
To better understand graphing linear equations and slope…
LET’S BREAK IT DOWN!
Graph a linear equation using a table of values.
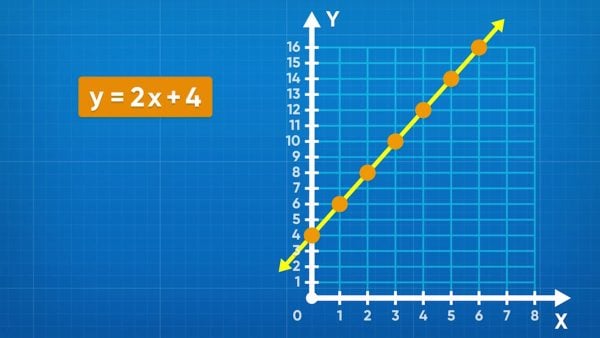
A table of values is a chart that relates the x- and y- coordinates for a set of points in a relation. Each row in the table represents an ordered pair you can use to draw a point on the coordinate plane. When you graph a linear relationship from an equation, choose a set of x-values and calculate their corresponding y-values to make the basis for the line. Let’s take the equation y=2x+4 for example. If you want to graph the point with an x-coordinate of 1, substitute 1 for x and then simplify the equation to find y. So, y=2x+4 becomes y=2(1)+4, which becomes y=6. Record the value 6 in the y column in the row where x = 1. Graph the point (1, 6) on the coordinate plane. Once you are done graphing all the points, connect them all with a straight line. This is the graph of the linear relation. Try this yourself: Write a table of values for y=3x+5 with x values {−2, −1, 0, 1, 2}, and then graph the linear relation from the table.
Graph a linear equation using a table of values. A table of values is a chart that relates the x- and y- coordinates for a set of points in a relation. Each row in the table represents an ordered pair you can use to draw a point on the coordinate plane. When you graph a linear relationship from an equation, choose a set of x-values and calculate their corresponding y-values to make the basis for the line. Let’s take the equation y=2x+4 for example. If you want to graph the point with an x-coordinate of 1, substitute 1 for x and then simplify the equation to find y. So, y=2x+4 becomes y=2(1)+4, which becomes y=6. Record the value 6 in the y column in the row where x = 1. Graph the point (1, 6) on the coordinate plane. Once you are done graphing all the points, connect them all with a straight line. This is the graph of the linear relation. Try this yourself: Write a table of values for y=3x+5 with x values {−2, −1, 0, 1, 2}, and then graph the linear relation from the table.
Graph a linear equation using the slope and y-intercept.
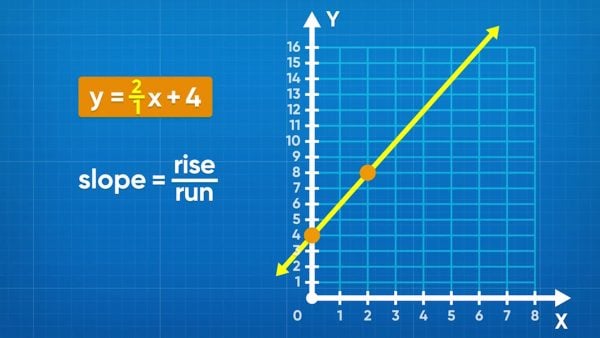
An easier way to graph a linear relation is by using the slope and y-intercept. The slope-intercept form of a line is y=mx+b, where m is the slope and b is the y-intercept. The y-intercept is a constant and is the point where the line crosses the y-axis. Graph this point first. The slope = [ggfrac]change-in-y/change-in-x[/ggfrac] . The numerator is how many units up you move, and the denominator is how many units right you move. Remember that any number is a fraction over 1. In our example y=2x+4, the slope is 2 and the y-intercept is 4. To graph this, first look at the y-axis and mark a point at the y-intercept, (0, 4). Next, move from that point 1 unit right and 2 units up to mark the next point. Repeat this as many times as you want before connecting all the points with a ruler to finish the graph. Try this yourself: Graph y=3x+5 using the slope and y-intercept.
Graph a linear equation using the slope and y-intercept. An easier way to graph a linear relation is by using the slope and y-intercept. The slope-intercept form of a line is y=mx+b, where m is the slope and b is the y-intercept. The y-intercept is a constant and is the point where the line crosses the y-axis. Graph this point first. The slope = [ggfrac]change-in-y/change-in-x[/ggfrac] . The numerator is how many units up you move, and the denominator is how many units right you move. Remember that any number is a fraction over 1. In our example y=2x+4, the slope is 2 and the y-intercept is 4. To graph this, first look at the y-axis and mark a point at the y-intercept, (0, 4). Next, move from that point 1 unit right and 2 units up to mark the next point. Repeat this as many times as you want before connecting all the points with a ruler to finish the graph. Try this yourself: Graph y=3x+5 using the slope and y-intercept.
Understand slope in a linear equation.
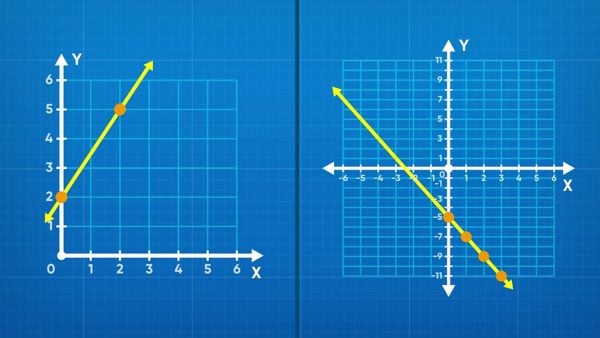
Slope can be positive or negative. This doesn’t mean good or bad, it just tells us whether the line slants up or down as it moves from left to right along the x-axis. Lines with positive slope slant upwards left to right, whereas lines with negative slope slant downwards. You can graph any linear relationship if you know 2 points on the graph and can connect them with your ruler. Similarly, you can calculate the slope of a graph using the coordinates of any two points on the line. slope = [ggfrac]rise/run[/ggfrac] = [ggfrac]change-in-y/change-in-x[/ggfrac] = [ggfrac](y₂-y₁)/(x₂-x₁)[/ggfrac] = m, where (x₁ =y₁) and ( x₂ = y₂) are points on the line. Try this yourself: Find the slope of the line that goes through (–2, 2) and (4, 7).
Understand slope in a linear equation. Slope can be positive or negative. This doesn’t mean good or bad, it just tells us whether the line slants up or down as it moves from left to right along the x-axis. Lines with positive slope slant upwards left to right, whereas lines with negative slope slant downwards. You can graph any linear relationship if you know 2 points on the graph and can connect them with your ruler. Similarly, you can calculate the slope of a graph using the coordinates of any two points on the line. slope = [ggfrac]rise/run[/ggfrac] = [ggfrac]change-in-y/change-in-x[/ggfrac] = [ggfrac](y₂-y₁)/(x₂-x₁)[/ggfrac] = m, where (x₁ =y₁) and ( x₂ = y₂) are points on the line. Try this yourself: Find the slope of the line that goes through (–2, 2) and (4, 7).
Determine an equation from a graph.
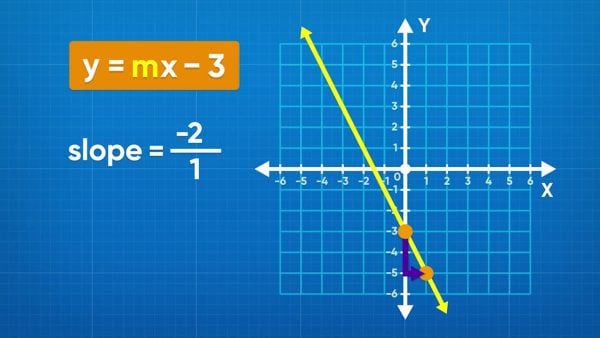
Just as you can graph a linear relation from the equation, you can find the equation from the graph. First, check for the y-intercept on the graph. Look for where the line crosses the y-axis and record that as “b.” Next, find any other point on the graph and determine the rise and run between the y-intercept and that point. Points that land exactly on the increments on the coordinate plane (lattice points) are best because you can see for sure what the coordinates are, and you don’t need to estimate any values. Use the rise and run to calculate the slope, “m.” Now that you have the slope and y-intercept, you can substitute them into the slope-intercept form equation y=mx+b. Try this yourself: Draw a linear relation on graphing paper, and then exchange your graph with a partner. Write the equation for the graph your partner drew and then check your work with your partner.
Determine an equation from a graph. Just as you can graph a linear relation from the equation, you can find the equation from the graph. First, check for the y-intercept on the graph. Look for where the line crosses the y-axis and record that as “b.” Next, find any other point on the graph and determine the rise and run between the y-intercept and that point. Points that land exactly on the increments on the coordinate plane (lattice points) are best because you can see for sure what the coordinates are, and you don’t need to estimate any values. Use the rise and run to calculate the slope, “m.” Now that you have the slope and y-intercept, you can substitute them into the slope-intercept form equation y=mx+b. Try this yourself: Draw a linear relation on graphing paper, and then exchange your graph with a partner. Write the equation for the graph your partner drew and then check your work with your partner.
GRAPH LINEAR EQUATIONS AND SLOPE VOCABULARY
Coordinate plane
Two number lines that intersect at 0 and are perpendicular to each other, where the horizontal axis is the x-axis, and the vertical axis is the y-axis
Origin
The point where the two number lines cross on a coordinate plane: (0, 0).
Ordered pair
Describes the position of a point on a coordinate plane. An ordered pair is written (x, y) where x is the distance from the origin on the x-axis, and y is the distance from the origin on the y-axis.
Slope
A rate that describes how y changes in relation to x. slope = [ggfrac]rise/run[/ggfrac] = [ggfrac]change in y/change in x[/ggfrac] = [ggfrac]( y₂ - y₁ )/( x₂ - x₁ )[/ggfrac].
y-intercept
The point where a line crosses the y-axis is called the y-intercept. The y-intercept is often represented as “b” in the slope-intercept form of a line.
Slope-intercept form of a line
The equation of a linear relation written in the form y=mx+b.
A table with two columns, with the left column labeled “x” and the right column labeled “y.” Each row in a table of values represents an ordered pair.
GRAPH LINEAR EQUATIONS AND SLOPE DISCUSSION QUESTIONS
What is slope?
The slope is the [ggfrac]rise/run[/ggfrac]. It is a rate that relates the two variables on a coordinate plane.
What is the difference between a positive slope and a negative slope?
A linear relation with a positive slope shows that as one variable increases the other also increases. This is the opposite of a negative slope, whereas one variable increases, the other decreases.
In the equation y=3x-10, identify the slope and y-intercept.
The slope is a rate, so is multiplied by the x-variable. Since 3 is multiplied by x, 3 is the slope. The y-intercept is a constant that is added in the equation. Since –10 is added, the y-intercept is −10. Note that y=3x-10 is the same as y=3x+(-10).
Identify the rate and the constant in the following example. “Molly operates a lemonade stand, and she writes a linear equation to model her profits. It costs $10 to make the lemonade, and she sells each glass for $2.”
The rate is the amount she sells each glass for, written as $2/glass. The constant is the cost of making the lemonade. Since the cost is something Molly needs to spend, it is negative. So, the constant is –$10.
Write the equation for the example in question 4. First, identify the slope and y-intercept. How would you label the coordinate plane in a graph of this equation?
The slope is a rate, so the slope is $2/glass. The y-intercept is a constant, so the y-intercept is –10. This makes the equation y=2x-10, where x represents the number of glasses sold and y represents the amount of profit. I would label the horizontal axis “Number of glasses sold” and the vertical axis “Profit.” This is because Molly uses the number of glasses sold to calculate her profit. The number of glasses sold is the independent variable, and the profit is the dependant variable.


 GENERATION GENIUS


x
Choose Your Free Trial Period
Get 30 Days Free
By inviting 4 other teachers to try it too.
Skip, I will use a 3 day free trial
Thank You!
Enjoy your free 30 days trial